math4finance
General
Algebra
Geometry
Coordinate-geometry
Statistics
Calculus
math4finance
math4finance
Home
General
Algebra
Geometry
Coordinate-geometry
Statistics
Calculus
MATH SOLVE
Home
Algebra
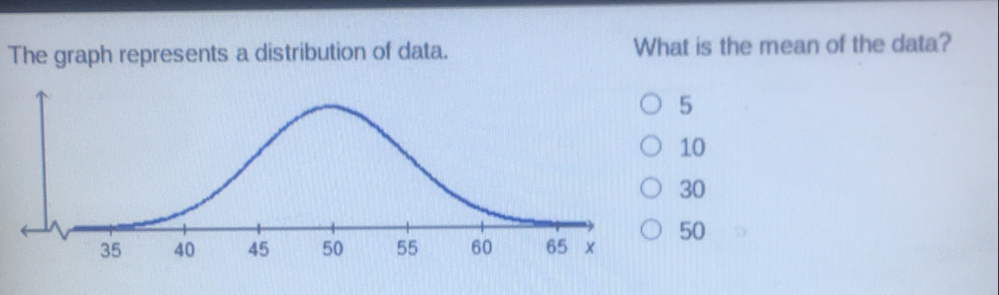
The graph represents a distribution of data. What is the mean of the data? 5 10 30 50
5 months ago
Q:
The graph represents a distribution of data. What is the mean of the data? 5 10 30 50
Accepted Solution
A: